PopVis Example
# Authors: Mayank Agrawal <mayankagrawal96@gmail.com>
#
# License: MIT
import numpy as np
import matplotlib.pyplot as plt

import pandas as pd
from spykes.plot.neurovis import NeuroVis
from spykes.plot.popvis import PopVis
from spykes.io.datasets import load_reward_data
import random
0 Initialization
0.1 Download Data
Download all files [here] However, we’ll only be looking at Mihili_08062013.mat (Monkey M, Session 4)
0.2 Read In Data
_, mat = load_reward_data()
0.3 Initialize Variables
event = 'rewardTime'
condition = 'rewardBool'
window = [-500, 1500]
binsize = 10
1 PopVis
1.1 Initiate all Neurons
def get_spike_time(raw_data, neuron_number):

    spike_times = raw_data['alldays'][0][
        'PMd_units'][0][:][neuron_number - 1][0][1:]
    spike_times = [i[0] for i in spike_times]

    return spike_times
def initiate_neurons(raw_data):

    neuron_list = list()

    for i in range((raw_data['alldays'][0]['PMd_units'][0][:]).shape[0]):
        spike_times = get_spike_time(raw_data, i + 1)

        # instantiate neuron
        neuron = NeuroVis(spike_times, name='PMd %d' % (i + 1))
        neuron_list.append(neuron)

    return neuron_list
neuron_list = initiate_neurons(mat)
1.2 Get Event Times
def create_data_frame(raw_data):

    data_df = pd.DataFrame()

    uncertainty_conditions = list()
    center_target_times = list()
    reward_times = list()
    reward_outcomes = list()

    for i in range(raw_data['alldays'].shape[0]):

        meta_data = raw_data['alldays'][i]['tt'][0]

        uncertainty_conditions.append(meta_data[:, 2])
        center_target_times.append(meta_data[:, 3])
        reward_times.append(meta_data[:, 6])
        reward_outcomes.append(meta_data[:, 7])

    data_df['uncertaintyCondition'] = np.concatenate(uncertainty_conditions)
    data_df['centerTargetTime'] = np.concatenate(center_target_times)
    data_df['rewardTime'] = np.concatenate(reward_times)
    data_df['rewardOutcome'] = np.concatenate(reward_outcomes)

    data_df['rewardBool'] = data_df['rewardOutcome'].map(lambda s: s == 32)

    # find time in between previous reward onset and start of current trial
    # shouldn't be more than 1500ms

    start_times = data_df['centerTargetTime']
    last_reward_times = np.roll(data_df['rewardTime'], 1)

    diffs = start_times - last_reward_times
    diffs[0] = 0

    data_df['consecutiveBool'] = diffs.map(lambda s: s <= 1.5)

    return data_df[((data_df['uncertaintyCondition'] == 5.0) |
                   (data_df['uncertaintyCondition'] == 50.0)) &
                   data_df['consecutiveBool']]
data_df = create_data_frame(mat)
print(len(data_df))
data_df.head()
Out:
691
1.3 Create PopVis Object
neuron_list = initiate_neurons(mat)[:10]  # let's just look at first 10 neurons
pop = PopVis(neuron_list)
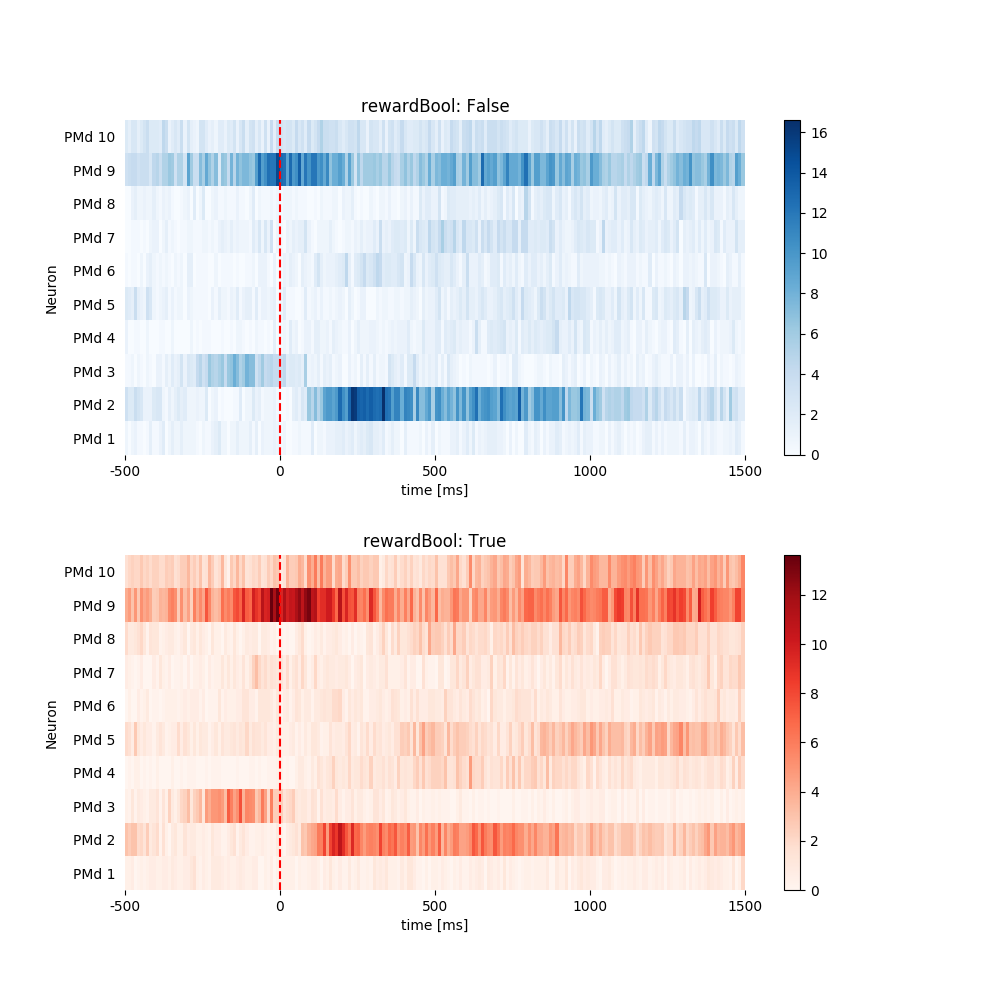
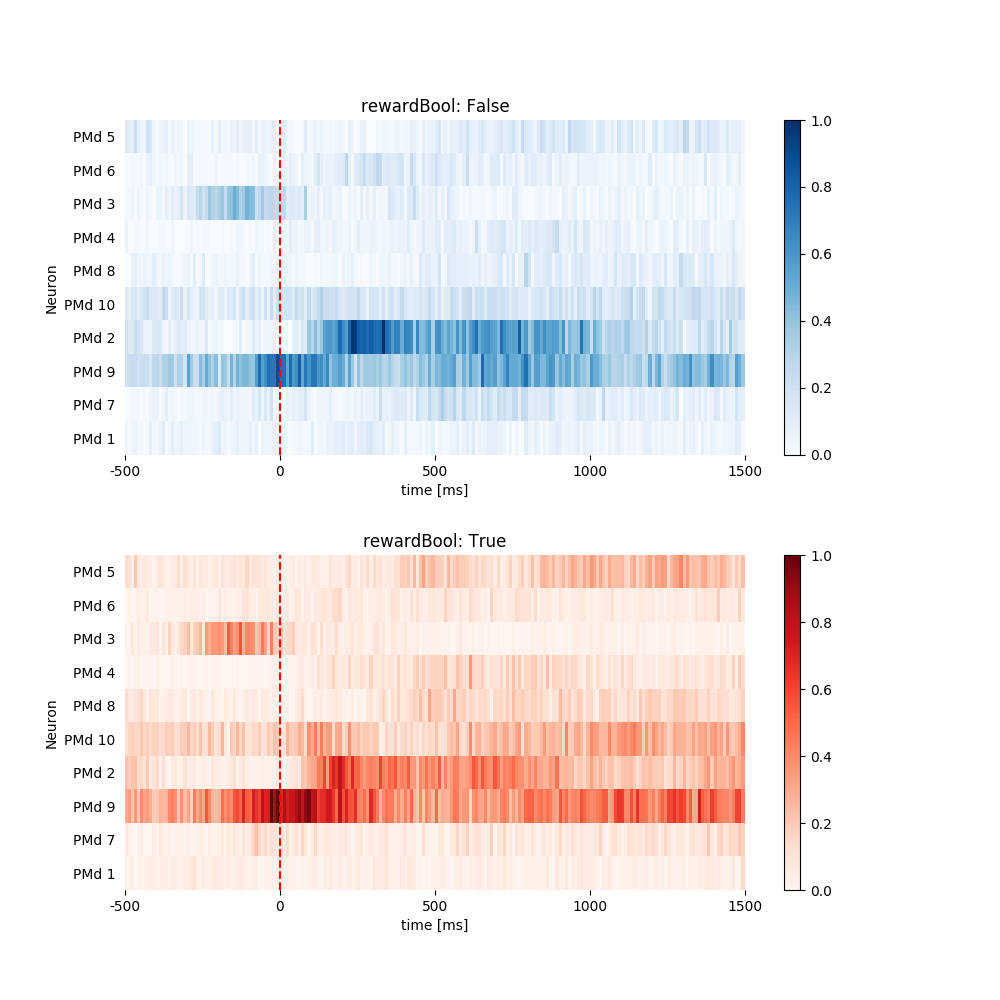
1.3.1 Plot Heat Map
fig = plt.figure(figsize=(10, 10))
fig.subplots_adjust(hspace=.3)
all_psth = pop.get_all_psth(
    event=event, df=data_df, conditions=condition, window=window,
    binsize=binsize, plot=True)
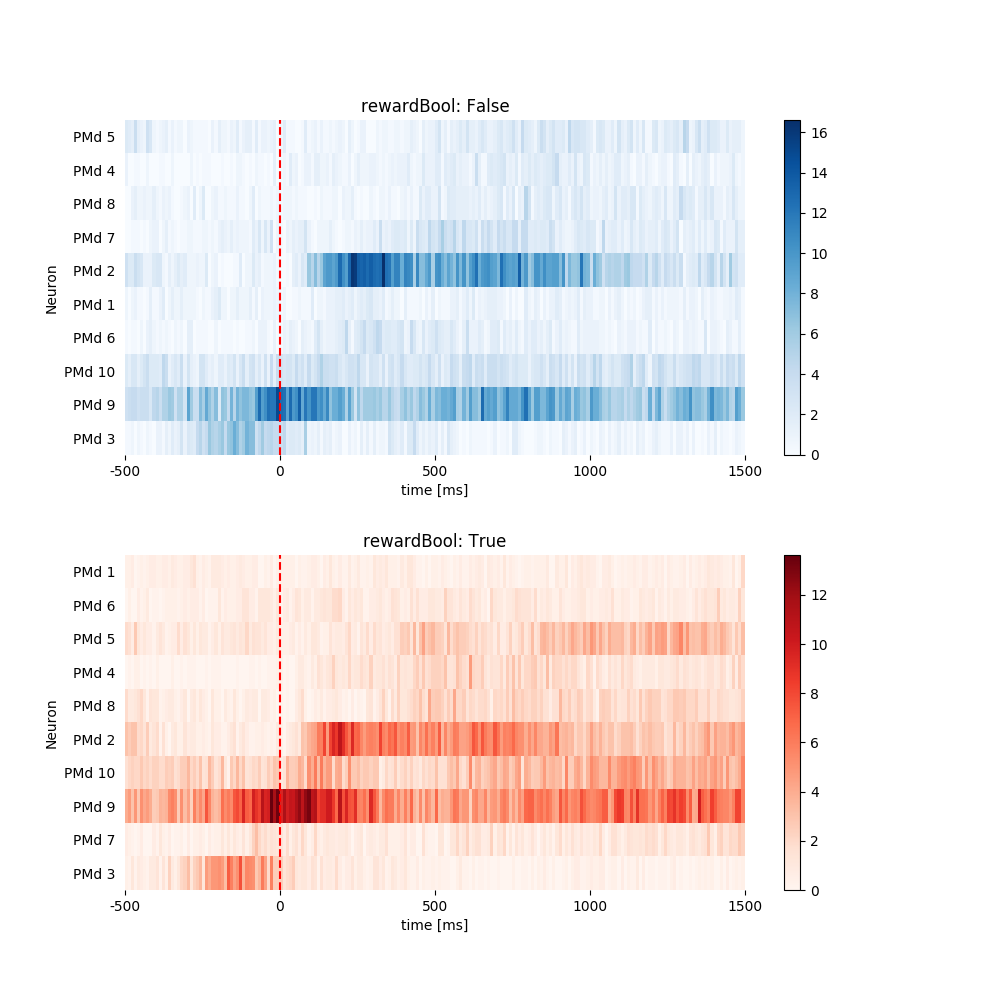
1.3.2 Plot Heat Map. Sort by Peak Latency
fig = plt.figure(figsize=(10, 10))
fig.subplots_adjust(hspace=.3)
pop.plot_heat_map(all_psth, sortby='latency')
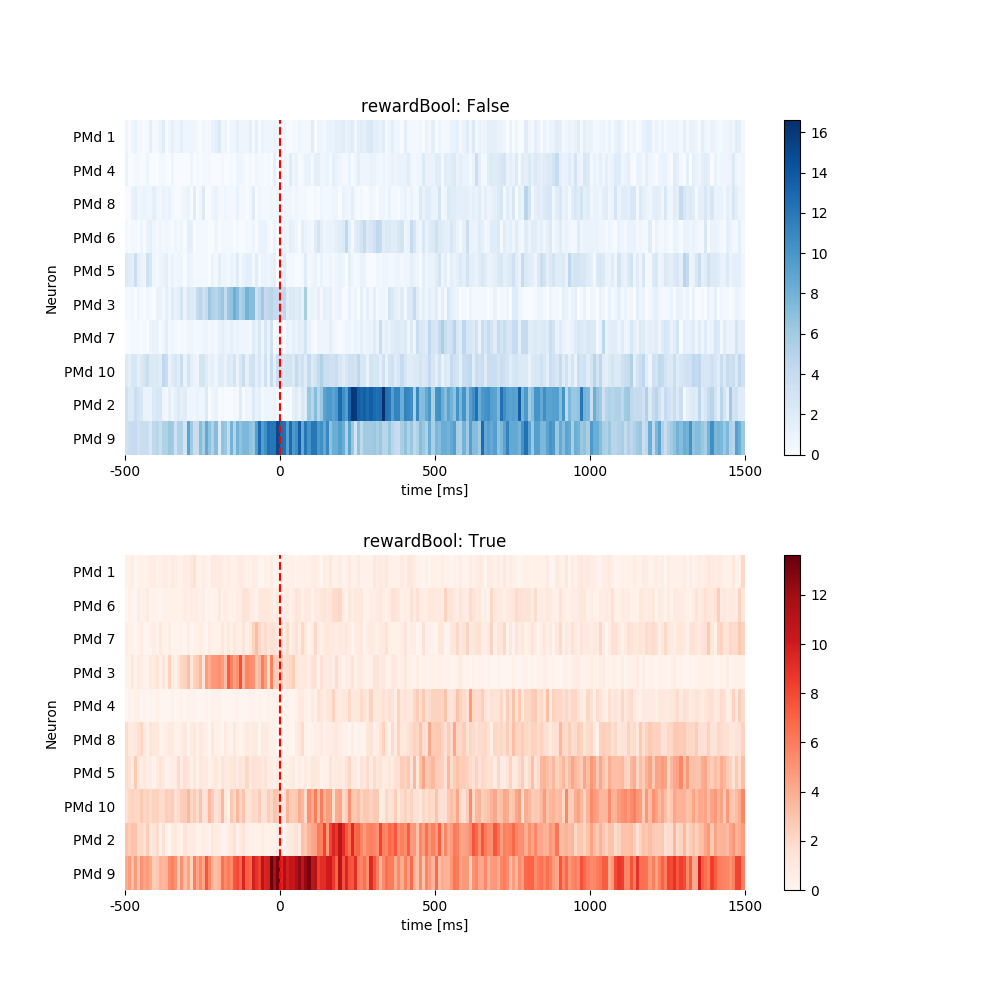
1.3.3 Plot Heat Map. Sort by Avg Firing Rate in Ascending Order.
fig = plt.figure(figsize=(10, 10))
fig.subplots_adjust(hspace=.3)
pop.plot_heat_map(all_psth, sortby='rate', sortorder='ascend')
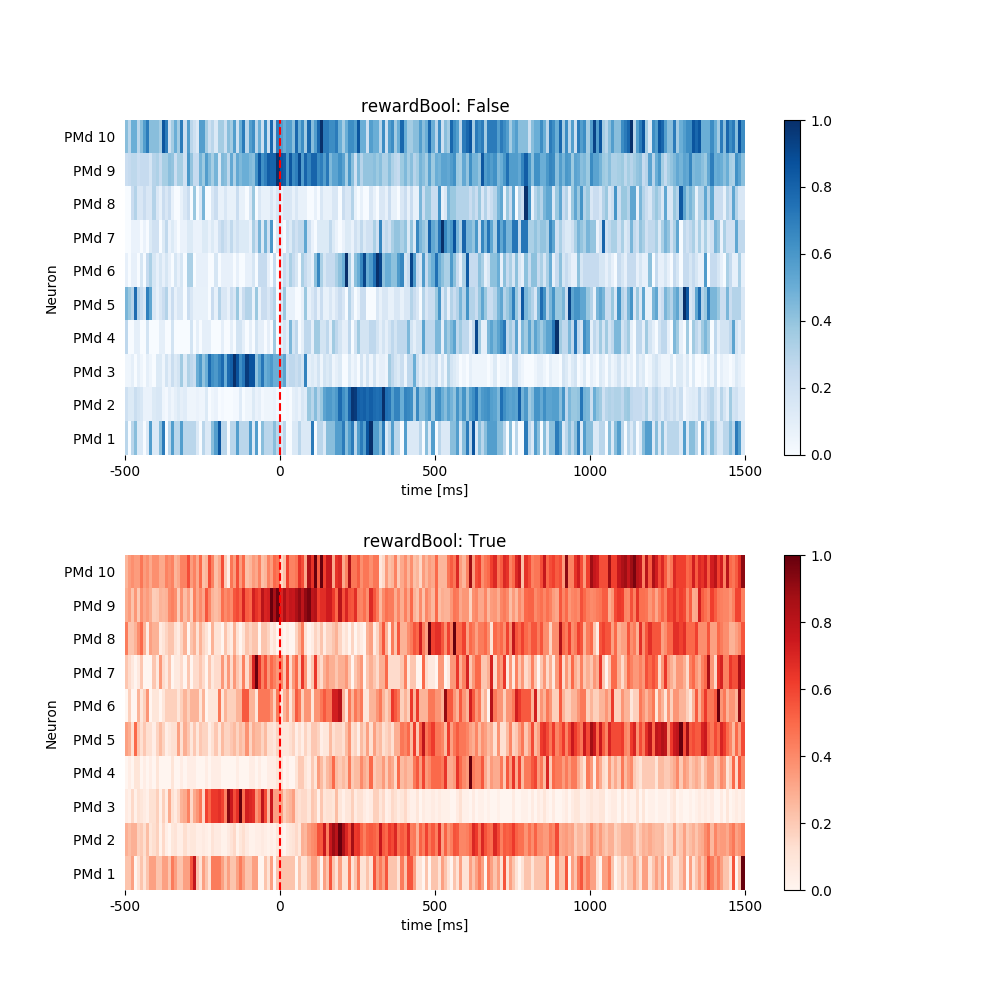
1.3.4 Plot Heat Map. Normalize Each Neuron Individually.
fig = plt.figure(figsize=(10, 10))
fig.subplots_adjust(hspace=.3)
pop.plot_heat_map(all_psth, normalize='each')
1.3.5 Plot Heat Map. Normalize All Neurons and Sort in Specified Order.
random_list = range(10)
random.shuffle(random_list)
print(random_list)
fig = plt.figure(figsize=(10, 10))
fig.subplots_adjust(hspace=.3)
pop.plot_heat_map(all_psth, normalize='all', sortby=random_list)
Out:
[4, 5, 2, 3, 7, 9, 1, 8, 6, 0]
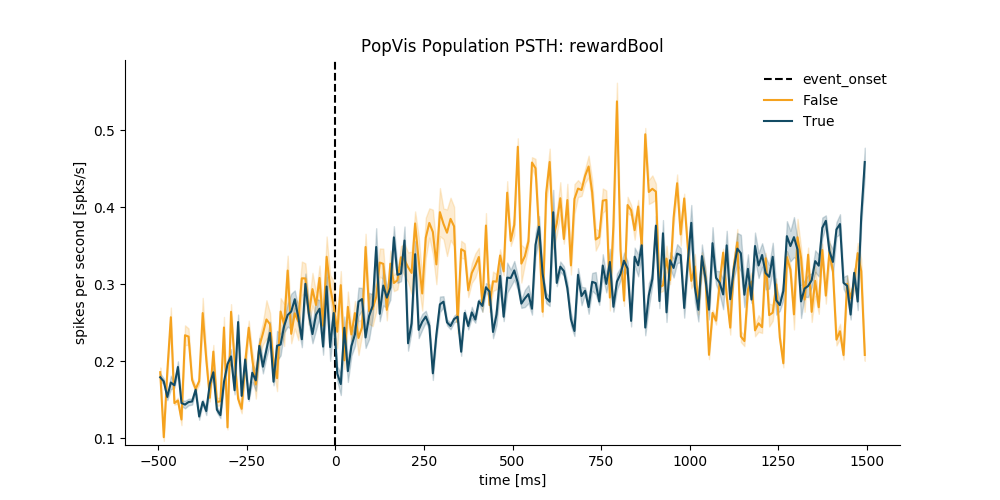
1.3.5. Plot Population PSTH
plt.figure(figsize=(10, 5))
pop.plot_population_psth(all_psth=all_psth)
Total running time of the script: ( 2 minutes 51.839 seconds)