CRCNS DataSet Example
A demonstration of Spykes’s functionality to reproduce a figure from Li et al’s “A motor cortex circuit for motor planning and movement.”
# Authors: Eric Larson <larson.eric.d@gmail.com>
#
# License: BSD (3-clause)
import os

import numpy as np
import pandas as pd
import matplotlib.pyplot as plt
import scipy.io

from spykes.plot.neurovis import NeuroVis
from spykes.config import get_data_directory

plt.style.use('seaborn-ticks')
0 Overview: Reproduce Figure
0.1 Article
Li, Nuo, et al. “A motor cortex circuit for motor planning and movement.” Nature 519.7541 (2015): 51-56. [link to paper]. We aim to reproduce this figure
0.2 Dataset
Nuo Li, Charles R Gerfen, Karel Svoboda (2014); Extracellular recordings from anterior lateral motor cortex (ALM) neurons of adult mice performing a tactile decision behavior. CRCNS.org [link to dataset]
1 Data
1.1 Download Data
Register in CRCNS [link to request account]
Download file data_structure_ANM218457.tar.gz [link]
Unzip it and you will find file data_structure_ANM218457_20131006.mat
Move this file to the right data directory.
1.2 Load Data
fpath = os.path.join('data_structure_ANM218457_20131006.mat')
mat = scipy.io.loadmat(fpath)
2 Get Spike Times
neuron_n = 9
spike_times = mat['obj']['eventSeriesHash'][0][
    0]['value'][0][0][0][neuron_n - 1][0][0][1]
spike_times = [i[0] for i in spike_times]

# instantiate neuron
neuron = NeuroVis(spike_times, neuron_n)
print('neuron %d has a firing rate of %0.2f spikes per second' %
      (neuron_n, neuron.firingrate))
Out:
neuron 9 has a firing rate of 5.07 spikes per second
Let’s use all the goodness of pandas to define all our conditions.
Here, we will create a set of extra columns in the data frame that are
going to be useful to select and plot PSTHs for specific conditions. We
aim to follow the principles outlined in Hadley Wickam’s white paper on
Tidy Data.
3 Get Event Times
data_df = pd.DataFrame()
data_df['trialStart'] = mat['obj']['trialStartTimes'][0][0][0]
data_df['cueTimes'] = np.squeeze(
    mat['obj']['trialPropertiesHash'][0][0][0][0][2][0][2])
data_df['RealCueTimes'] = data_df['trialStart'] + data_df['cueTimes']

# Collect all the events and display them
events = ['trialStart', 'cueTimes', 'RealCueTimes']
data_df[events].head()
4 Get Features
trialTypeMat = mat['obj']['trialTypeMat'][0][0].astype(np.bool_)
trialTypeStr = np.squeeze(
    np.stack(np.squeeze(mat['obj']['trialTypeStr'][0][0])))

for ind, feat in enumerate(trialTypeStr):
    data_df[str(feat)] = trialTypeMat[ind]

data_df['GoodTrials'] = np.squeeze(
    mat['obj']['trialPropertiesHash'][0][0][0][0][2][0][3]).astype(np.bool_)

# Collect all features and display them
features = ['HitR', 'HitL', 'ErrR', 'ErrL', 'NoLickR',
            'NoLickL', 'LickEarly', 'StimTrials', 'GoodTrials']
data_df[features].head()
5 Define Features
features_of_interst = ['HitR', 'HitL', 'ErrR', 'ErrL']

data_df['response'] = data_df[features_of_interst].apply(
    lambda row: row.argmax() if row.max() else '', axis=1)
data_df['correct'] = data_df['response'].map(
    lambda s: {'Hit': True, 'Err': False, '': np.nan}[s[:3]])
data_df['response'] = data_df['response'].map(
    lambda s: {'L': 'Lick left', 'R': 'Lick right', '': ''}[s[-1:]])

data_df[['HitR', 'HitL', 'ErrR', 'ErrL', 'correct', 'response']].head()
Let’s put the events and the augmented features into a new data frame which we will use everywhere below.
# isolate trials of interest
trials_df = data_df[((data_df['GoodTrials'] == True) &
                    (data_df['correct'] == True))]
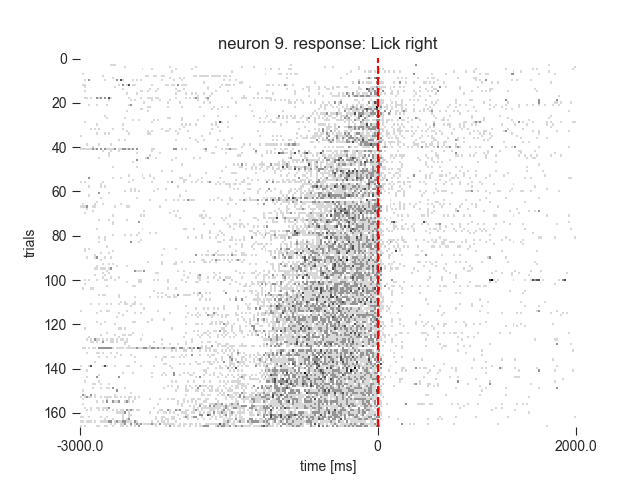
6 Plots
6.1 Rasters
event = 'RealCueTimes'
conditions = 'response'
window = [-3000, 2000]

rasters_fig2b1 = neuron.get_raster(event=event,
                                   conditions=conditions,
                                   df=trials_df,
                                   window=window,
                                   binsize=20,
                                   sortby='rate',
                                   sortorder='ascend')
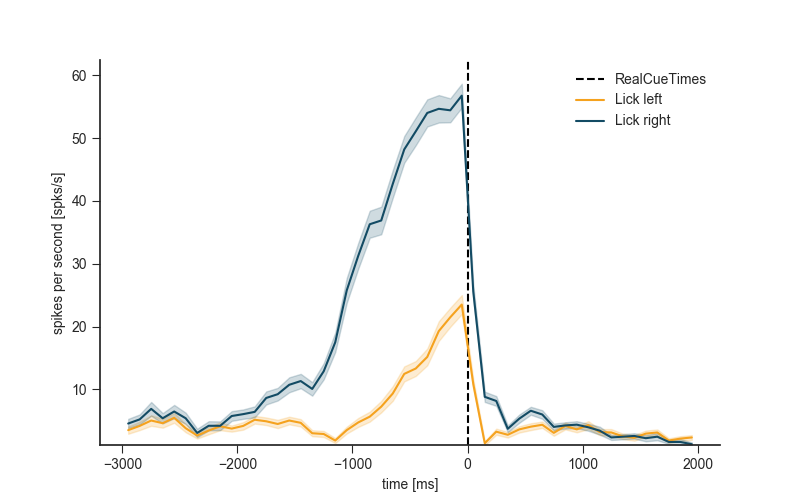
6.2 PSTH
plt.figure(figsize=(8, 5))
neuron.get_psth(event=event,
                df=trials_df,
                conditions=conditions,
                window=window,
                binsize=100)
plt.title('')
plt.show()
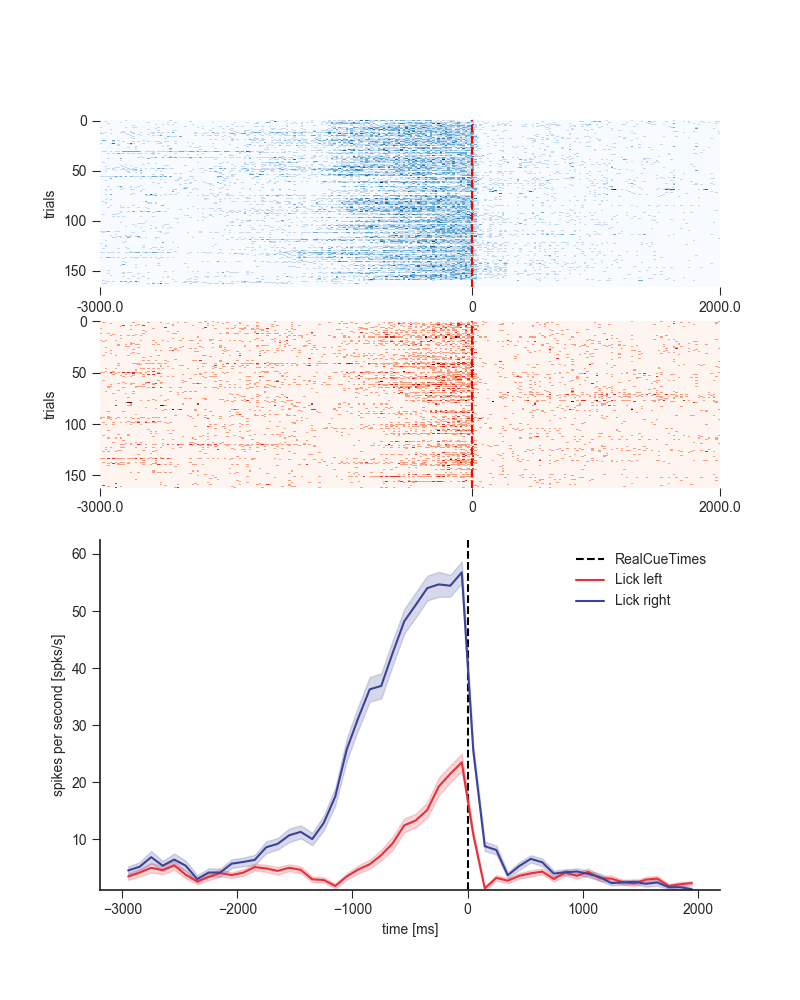
6.3 Reproduce Figure
plt.style.use('seaborn-ticks')

cmap = [plt.get_cmap('Blues'), plt.get_cmap('Reds')]
colors = ['#E82F3A', '#3B439A']


# get rasters------------------------------------------------------
rasters_fig2b1 = neuron.get_raster(event=event,
                                   conditions=conditions,
                                   df=trials_df,
                                   window=window,
                                   binsize=20,
                                   plot=False)


plt.figure(figsize=(8, 10))
cond_ids = rasters_fig2b1['data'].keys()[::-1]

# plot rasters-------------------------------------------------------
for i, cond_id in enumerate(cond_ids):
    plt.subplot(4, 1, i + 1)
    neuron.plot_raster(rasters=rasters_fig2b1,
                       cond_id=cond_id,
                       cmap=cmap[i],
                       sortby=None,
                       has_title=False)
    plt.xlabel('')


# plot psth-------------------------------------------------------
plt.subplot(212)
psth = neuron.get_psth(event=event,
                       conditions=conditions,
                       df=trials_df,
                       window=window,
                       binsize=100,
                       plot=True,
                       colors=colors)
plt.title('')
plt.show()
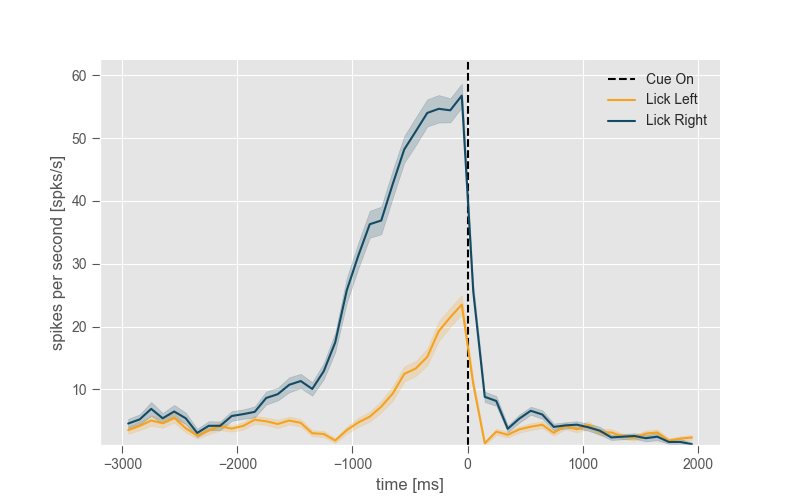
6.4 ggplot
plt.style.use('ggplot')

plt.figure(figsize=(8, 5))
neuron.get_psth(event=event,
                conditions=conditions,
                df=trials_df,
                event_name='Cue On',
                window=window,
                conditions_names=['Lick Left', 'Lick Right'],
                binsize=100)
plt.title('')
plt.show()
Total running time of the script: ( 0 minutes 4.161 seconds)