Neural Coding Reward Example
A demonstration to use Spykes’ functionality to reproduce Ramkumar et al’s “Premotor and Motor Cortices Encode Reward.”
# Authors: Mayank Agrawal <mayankagrawal96@gmail.com>
#
# License: MIT
import matplotlib.pyplot as plt
import numpy as np
import pandas as pd
from spykes.plot.neurovis import NeuroVis
from spykes.io.datasets import load_reward_data
0 Overview: Reproduce Figure
0.1 Article
Ramkumar, Pavan, et al. “Premotor and Motor Cortices Encode Reward.” PloS one 11.8 (2016)
0.2 Dataset
Download all files [here] However, we’ll only be looking at Mihili_07112013.mat (Monkey M, Session 1) and Mihili_08062013.mat (Monkey M, Session 4)
0.3 Initialization
event = 'rewardTime'
condition = 'rewardBool'
window = [-500, 1500]
binsize = 10
1 First Graph of Panel A
sess_one, sess_four = load_reward_data()
1.1 Initiate all Neurons
def get_spike_time(raw_data, neuron_number):

    spike_times = raw_data['alldays'][0]['PMd_units'][0][:]
    spike_times = spike_times[neuron_number - 1][0][1:]
    spike_times = [i[0] for i in spike_times]

    return spike_times
def initiate_neurons(raw_data):

    neuron_list = list()

    for i in range((raw_data['alldays'][0]['PMd_units'][0][:]).shape[0]):
        spike_times = get_spike_time(raw_data, i + 1)

        # instantiate neuron
        neuron = NeuroVis(spike_times, name='PMd %d' % (i + 1))
        neuron_list.append(neuron)

    return neuron_list
neuron_list = initiate_neurons(sess_four)
1.2 Get Event Times
def create_data_frame(raw_data):

    data_df = pd.DataFrame()

    uncertainty_conditions = list()
    center_target_times = list()
    reward_times = list()
    reward_outcomes = list()

    for i in range(raw_data['alldays'].shape[0]):

        meta_data = raw_data['alldays'][i]['tt'][0]

        uncertainty_conditions.append(meta_data[:, 2])
        center_target_times.append(meta_data[:, 3])
        reward_times.append(meta_data[:, 6])
        reward_outcomes.append(meta_data[:, 7])

    data_df['uncertaintyCondition'] = np.concatenate(uncertainty_conditions)
    data_df['centerTargetTime'] = np.concatenate(center_target_times)
    data_df['rewardTime'] = np.concatenate(reward_times)
    data_df['rewardOutcome'] = np.concatenate(reward_outcomes)

    data_df['rewardBool'] = data_df['rewardOutcome'].map(lambda s: s == 32)

    # find time in between previous reward onset and start of current trial
    # shouldn't be more than 1500ms

    start_times = data_df['centerTargetTime']
    last_reward_times = np.roll(data_df['rewardTime'], 1)

    diffs = start_times - last_reward_times
    diffs[0] = 0

    data_df['consecutiveBool'] = diffs.map(lambda s: s <= 1.5)

    return data_df[((data_df['uncertaintyCondition'] == 5.0) |
                    (data_df['uncertaintyCondition'] == 50.0)) &
                   data_df['consecutiveBool']]
data_df = create_data_frame(sess_four)
print(len(data_df))
data_df.head()
Out:
691
1.3 Match Peak Velocities
def find_velocities_in_range(raw_data, dataframe, min_vel, max_vel, min_time,
                             max_time):

    all_velocities = raw_data['alldays'][0]['kin'][0]['vel'][0][0]

    max_velocities = np.empty(len(dataframe))
    peak_times = np.empty(len(dataframe))

    for i in range(len(dataframe)):

        # find time range for potential peak velocity
        start_time = dataframe['rewardTime'][i] + .2
        end_time = dataframe['rewardTime'][i] + 1.5

        # find velocities in the time range
        indices = (all_velocities[:, 0] >= start_time) & (
            all_velocities[:, 0] <= end_time)
        in_time = all_velocities[indices]

        # find max velocity in given time range
        velocity_norms = np.square(in_time[:, 1]) + np.square(in_time[:, 2])

        max_velocity_index = np.argmax(velocity_norms)

        max_velocities[i] = velocity_norms[max_velocity_index]**.5
        peak_times[i] = in_time[max_velocity_index, 0]

    dataframe['maxVelocity'] = max_velocities
    dataframe['peakTimesDiff'] = peak_times - dataframe['rewardTime']

    return dataframe[((dataframe['maxVelocity'] >= min_vel) &
                      (dataframe['maxVelocity'] <= max_vel)) &
                     ((dataframe['peakTimesDiff'] >= min_time) &
                      (dataframe['peakTimesDiff'] <= max_time))]
trials_df = find_velocities_in_range(
    sess_four, data_df.reset_index(), 11, 16, .55, .95)
print(len(trials_df))
trials_df.head()
Out:
223
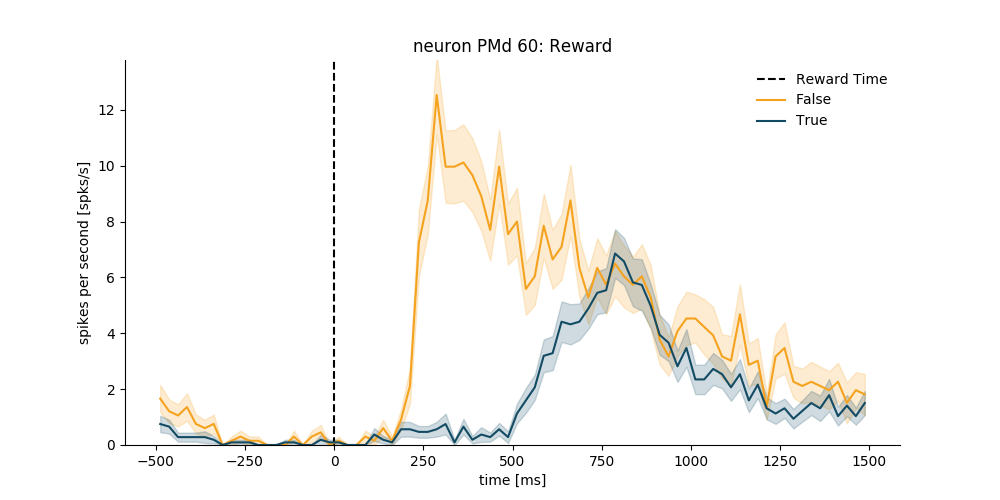
1.4 Plot PSTHs
Before Matching
neuron_number = 60
neuron = neuron_list[neuron_number - 1]

plt.figure(figsize=(10, 5))
psth = neuron.get_psth(event=event,
                       conditions=condition,
                       df=data_df,
                       window=[-500, 1500],
                       binsize=25,
                       event_name='Reward Time')

plt.title('neuron %s: Reward' % neuron.name)
plt.show()
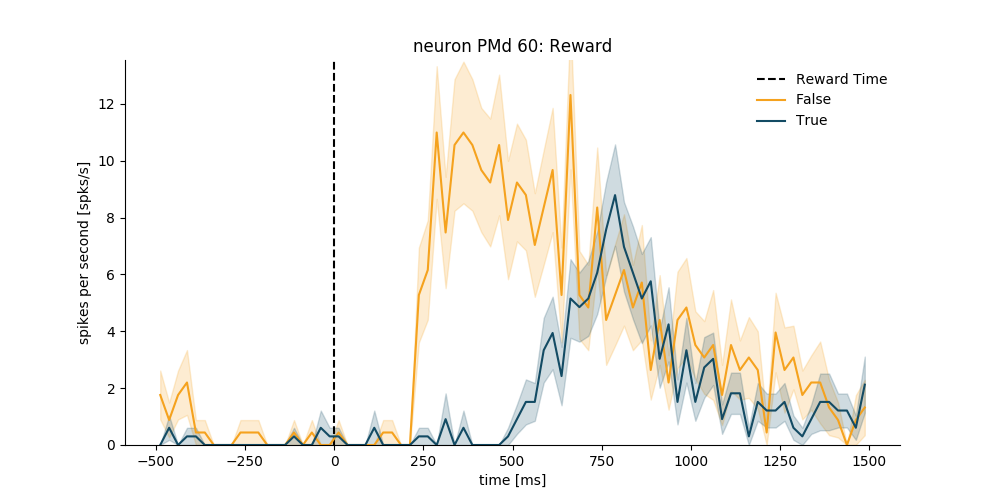
After Velocity Matching
neuron_number = 60
neuron = neuron_list[neuron_number - 1]

plt.figure(figsize=(10, 5))
psth = neuron.get_psth(event=event,
                       conditions=condition,
                       df=trials_df,
                       window=[-500, 1500],
                       binsize=25,
                       event_name='Reward Time')

plt.title('neuron %s: Reward' % neuron.name)
plt.show()
2 First Graph of Panel C
neuron_list = initiate_neurons(sess_one)
data_df = create_data_frame(sess_one)
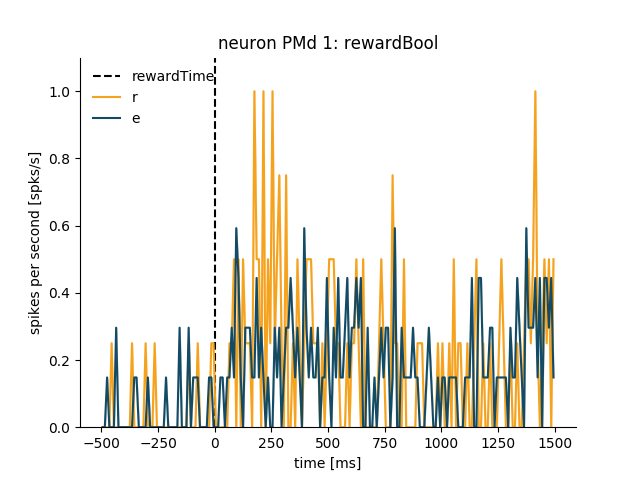
2.1 Normalize PSTHs
def normalize_psth(neuron, dataframe):

    psth = neuron.get_psth(event=event,
                           conditions=condition,
                           df=dataframe,
                           window=window,
                           binsize=binsize,
                           plot=False)

    # find all max rates, and find max of max rates

    max_rates = list()

    for i, cond_id in enumerate(np.sort(psth['data'].keys())):
        max_rates.append(np.amax(psth['data'][cond_id]['mean']))

    max_rate = max(max_rates)

    # divide all means by max to normalize

    for i, cond_id in enumerate(np.sort(psth['data'].keys())):

        psth['data'][cond_id]['mean'] /= max_rate
        psth['data'][cond_id]['sem'] = 0  # population SEM calculated later

    return psth
neuron = neuron_list[0]  # example
new_psth = normalize_psth(neuron, data_df)
neuron.plot_psth(new_psth, event, condition)
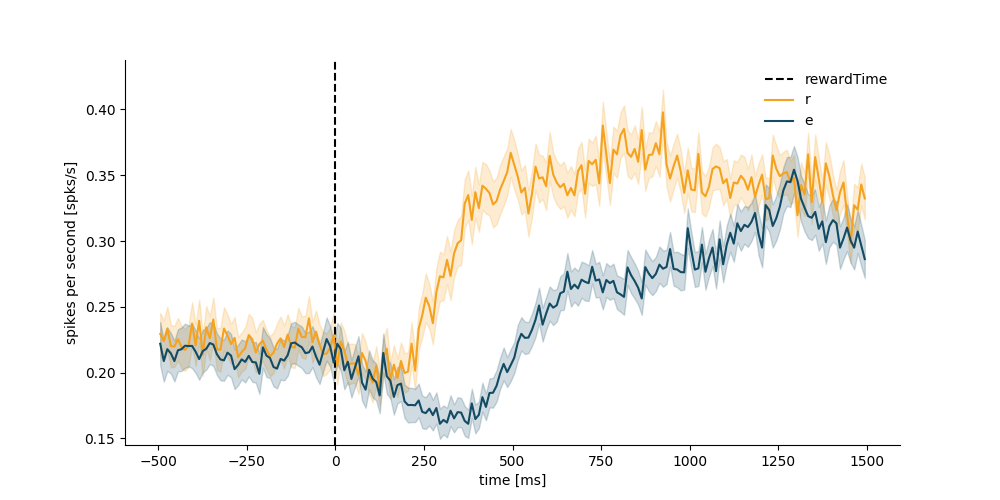
2.2 Find Population Average
psth_dict = {}
for cond_id in np.sort(psth['data'].keys()):
    psth_dict[cond_id] = list()


# add all normalized psth's
for neuron in neuron_list:

    norm_psth = normalize_psth(neuron, data_df)

    for cond_id in np.sort(psth['data'].keys()):
        psth_dict[cond_id].append(norm_psth['data'][cond_id]['mean'])

for key in psth_dict:
    psth_dict[key] = np.array(psth_dict[key])

# get base psth

base_neuron = neuron_list[0]
psth = normalize_psth(base_neuron, data_df)

# update mean and SEM to reflect population

for cond_id in np.sort(psth['data'].keys()):

    psth['data'][cond_id]['mean'] = np.mean(psth_dict[cond_id], axis=0)
    psth['data'][cond_id]['sem'] = (
        np.var(psth_dict[cond_id], axis=0) / len(neuron_list))**.5
2.3 Plot PSTH
plt.figure(figsize=(10, 5))
neuron.plot_psth(psth, event, condition)
plt.title("")
plt.show()
Total running time of the script: ( 3 minutes 32.175 seconds)